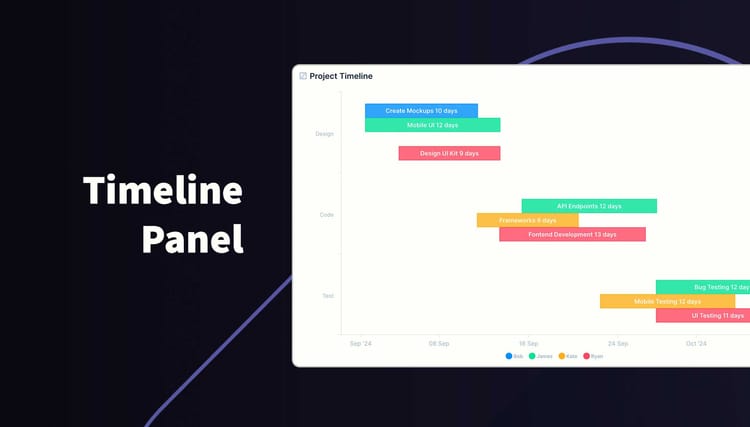
Directus Timeline Chart Panel
Present a series of tasks or events with a start and end date on a graph. You can also group data into categories on the y axis and separate tasks into different colors.
Directus Funnel Chart Panel
Present a list of numbers in an ascending or descending funnel chart as a Panel on your Directus Dashboard!
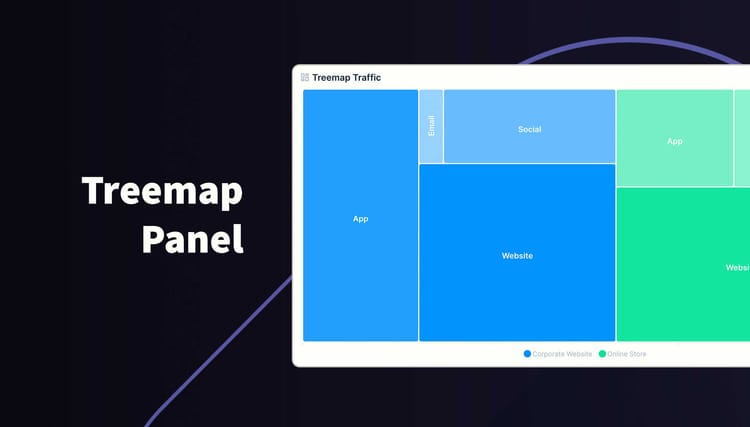
Directus Treemap Chart Panel
Present a cluster or boxes where the size of each box represent the value. You can also group data into categories which are presented in different colors.
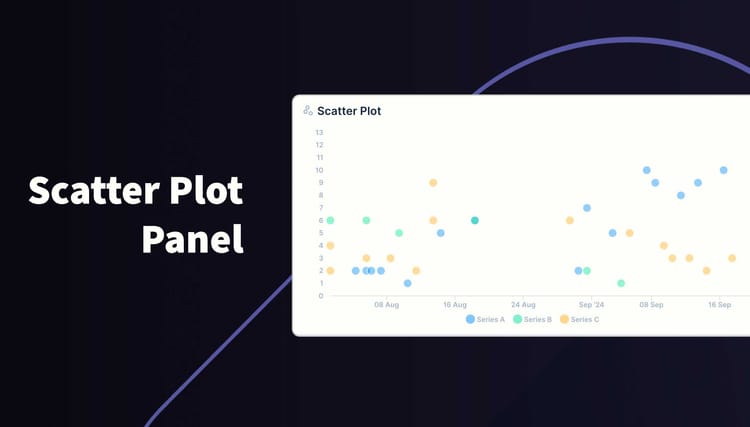
Directus Scatter Plot Panel
Present a list of X and Y coordinates in an Scatter Plot as a Panel on your Directus Dashboard!
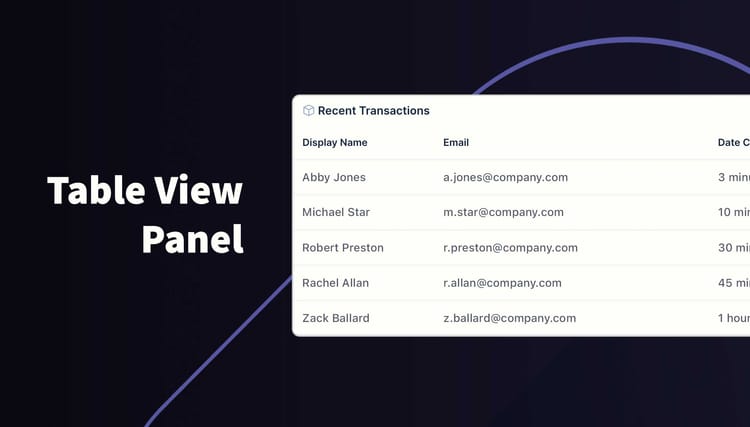
Directus Panel Table View
Output data from across multiple tables using this extension.